project / active
ProcessLens
CPU, memory and disk history for Windows: it answers "what slowed my PC down earlier?" and says what to do about it.
problem
The PC stutters for a few minutes, and by the time Task Manager is open everything is back to normal and there's no telling what it was. Task Manager only shows now. I wanted history: what ran, how much it used, whether that's normal for that program, and what to do about it.
what it is
What slowed my PC down earlier?
ProcessLens is a Windows tool that sits quietly in the tray and records, every 2 seconds, how much CPU, memory and disk each process that matters uses. When the PC slows down you don't have to catch it in the act: open ProcessLens later and see when the slowdown was, which program was behind it, what it normally uses and what you can do about it. History and explanation first; a live view is the extra. Version 0.1.0: open source (MIT), free, in Polish and English, light and dark.
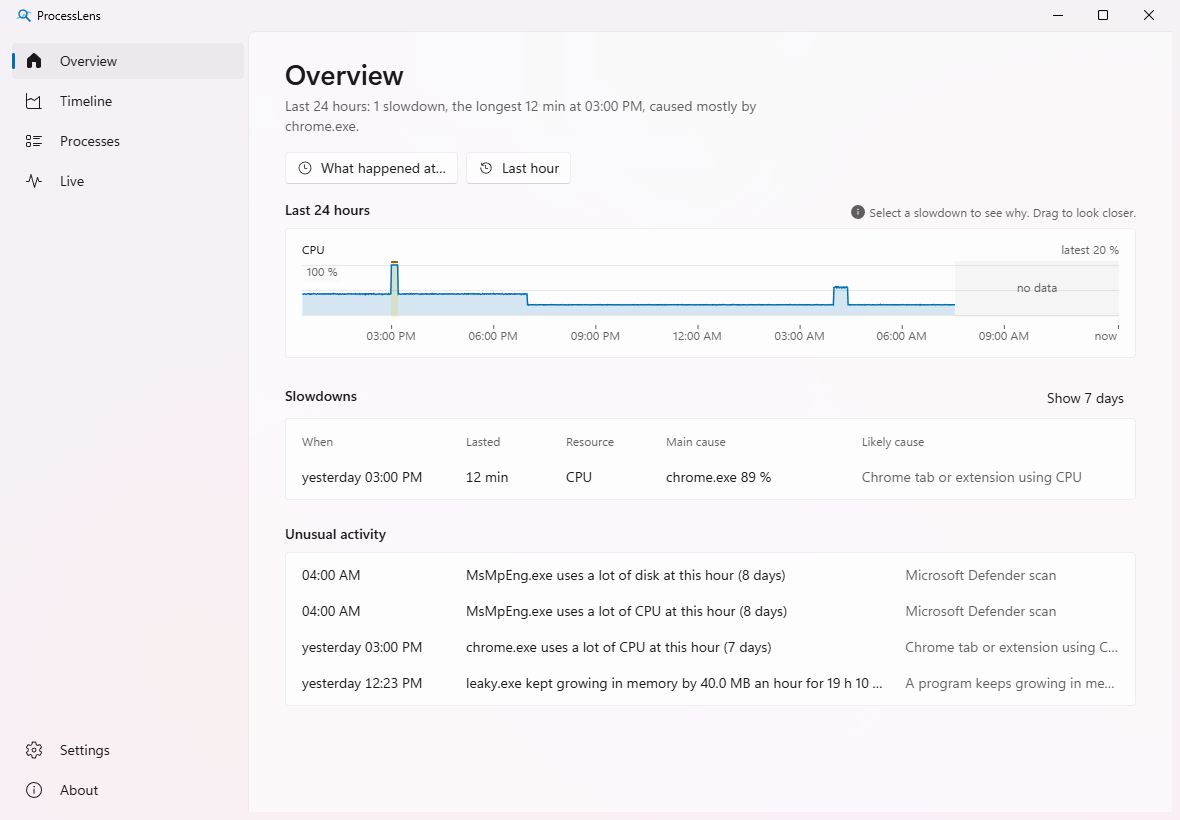
Overview: the day in one sentence
The first page answers the question before you ask it: "Last 24 hours: 1 slowdown, the longest 12 min at 03:00 PM, caused mostly by chrome.exe". Below that:
- The day's CPU chart with slowdowns marked; click one to see why, drag to look closer.
- A slowdowns table: when, how long, which resource (CPU, memory, disk), the main culprit with its share, and the likely cause. "Show 7 days" reaches further back.
- Unusual activity, such as "MsMpEng.exe uses a lot of disk at this hour (8 days)" as a Microsoft Defender scan, or a program whose memory has been growing for 19 hours.
- "What happened at…?": enter a time and get the processes and events of that moment, with a shortcut to the last hour.
Timeline
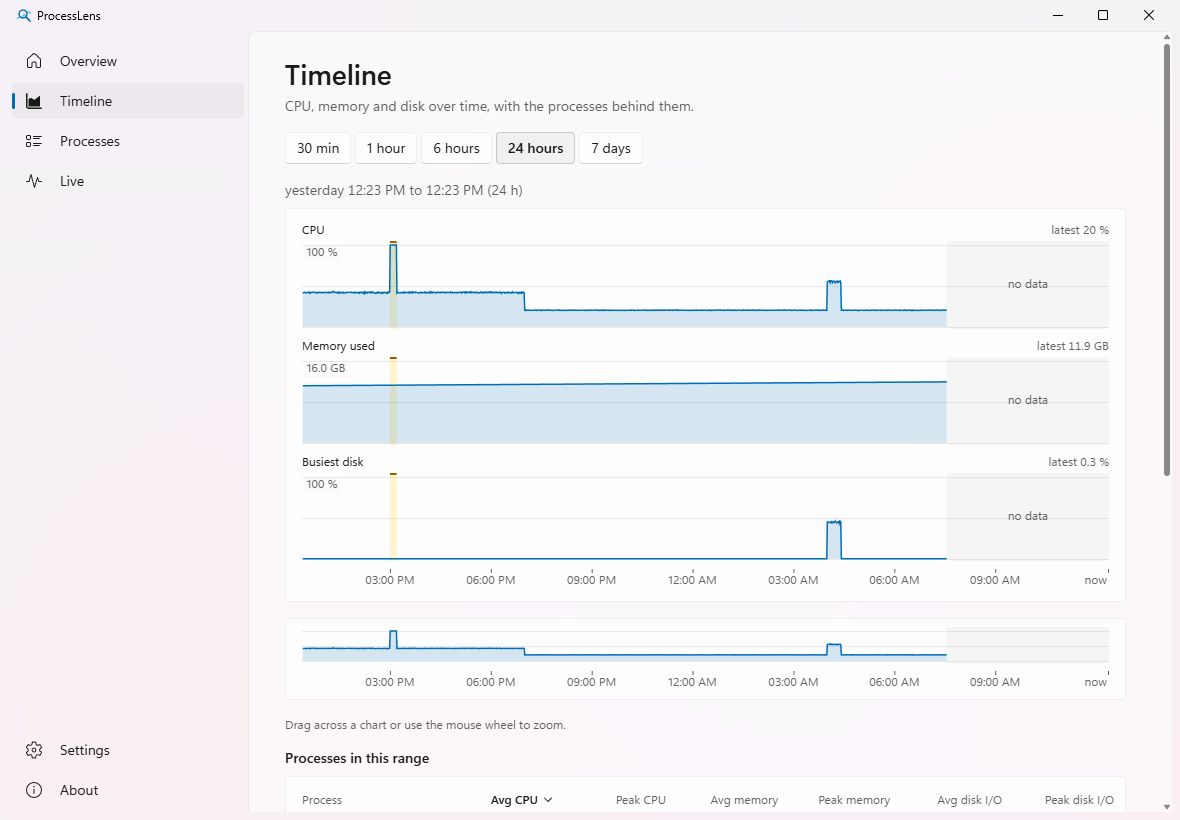
CPU, memory and the busiest disk on one screen, over 30 minutes, 1 hour, 6 hours, 24 hours or 7 days. Drag across a chart or use the mouse wheel to zoom into any stretch, and the table below lists the processes of that range: average and peak CPU, memory and disk, sortable. Each chart labels its latest value ("latest 20 %", and the time and value while you hover), the time axis always ends at "now", and stretches without samples, for example while recording was paused, are clearly marked "no data".
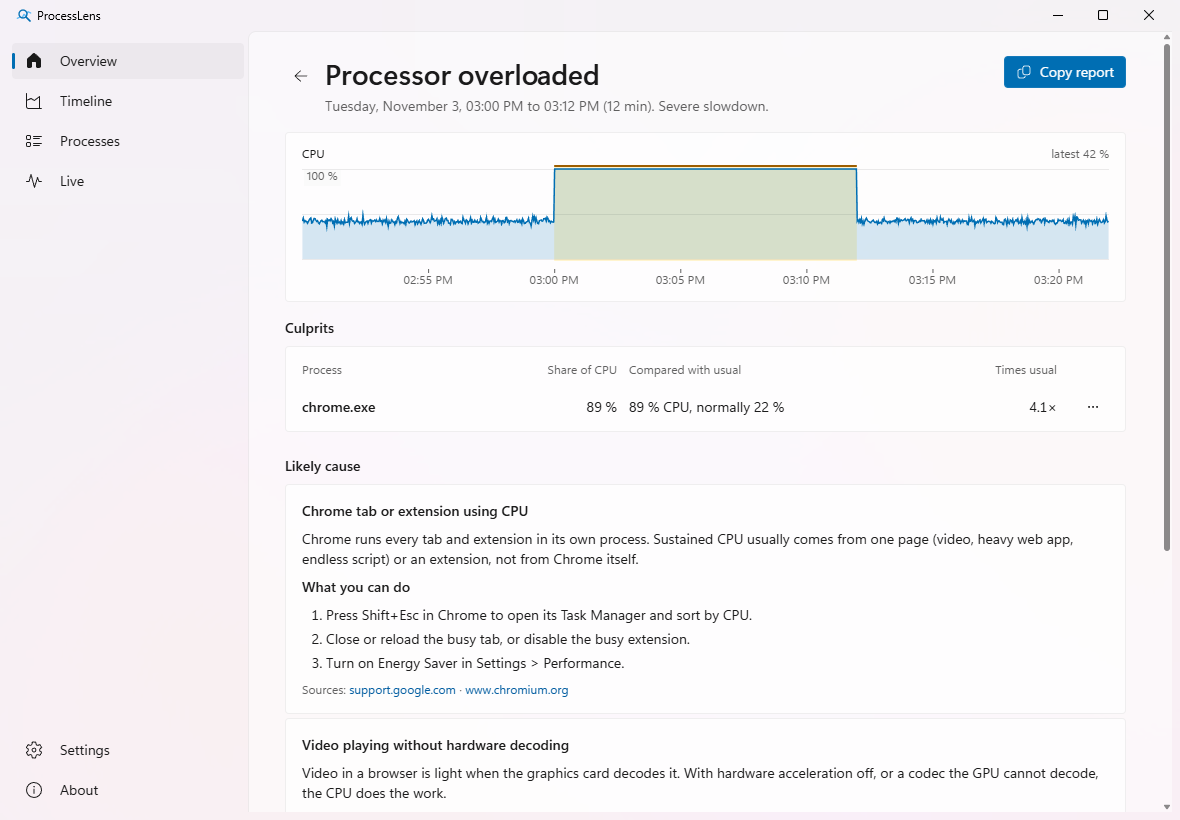
Slowdown details: the culprit, the cause, what to do
A slowdown isn't a single spike but sustained pressure: CPU at or above 85 %, free memory below 10 % (or commit above 90 %), or a disk at or above 90 % active with requests waiting, for at least 20 seconds. Every threshold is adjustable.
- Culprits compared with their usual use: "89 % CPU, normally 22 %, 4.1 times usual". Usual use is that program's average for that hour of day, so a nightly antivirus scan doesn't look suspicious just because it's big.
- Services inside svchost.exe: when "Service Host" is the culprit, ProcessLens tells you which Windows service is behind it, such as SysMain, Delivery Optimization or Windows Update, and explains that specific service instead of giving general advice. It records only service names and needs no administrator rights for it.
- Likely cause and what to do: a short explanation, steps to take and links to sources (mostly Microsoft Learn and vendors' support pages).
- Actions: open the program's location, end it (only when you click) and Copy report, the whole slowdown as text to paste into a forum post or a bug report.
Knowledge base: 94 causes, offline, no AI
The explanations come from a base of 94 entries written for ProcessLens: Windows components and services (Windows Update, Defender scans, search indexing), antivirus programs, browser tabs, OneDrive and other sync clients, games and launchers, WSL, Docker and other development tools, and a generic answer per resource. It ships with the app, so it works without the internet and without a language model. Every entry links to sources to read further, and a match is a likely cause, not a diagnosis. The advice is safe: no registry hacks and no turning protection off.
Processes and unusual activity
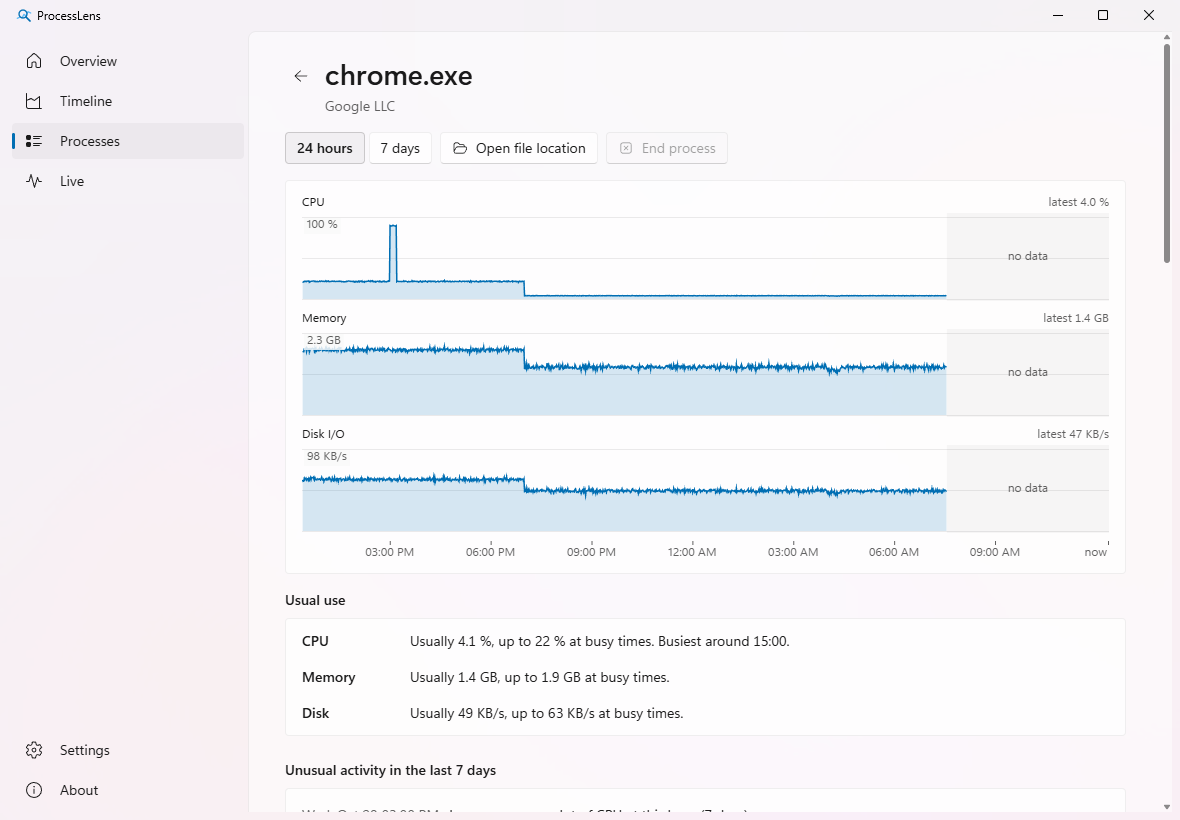
Every program has its own page: publisher, a day or a week of CPU, memory and disk, its usual use ("usually 4.1 % CPU, up to 22 % at busy times, busiest around 15:00") and its unusual activity over the last 7 days. You can open the file location from there. ProcessLens picks out by itself:
- spikes well above a program's usual use,
- memory leaks, memory that keeps growing for hours,
- daily jobs, such as a program that gets busy at 15:00 every day,
- startup load after sign-in, and new programs that weren't there before.
There's also a Live page with current use, for when you want to watch right now. The whole app is fully usable from the keyboard.
Detailed logs
Normal history is enough to name the culprit. When you need more, say for a problem that comes back every few days, a detailed log records every process 2–4 times a second with system counters for 5–60 minutes. Start it from the page, the tray menu (15 minutes) or an AI client. It stops by itself after the length you chose or at its size limit, and while it runs every page shows a bar with a Stop button.
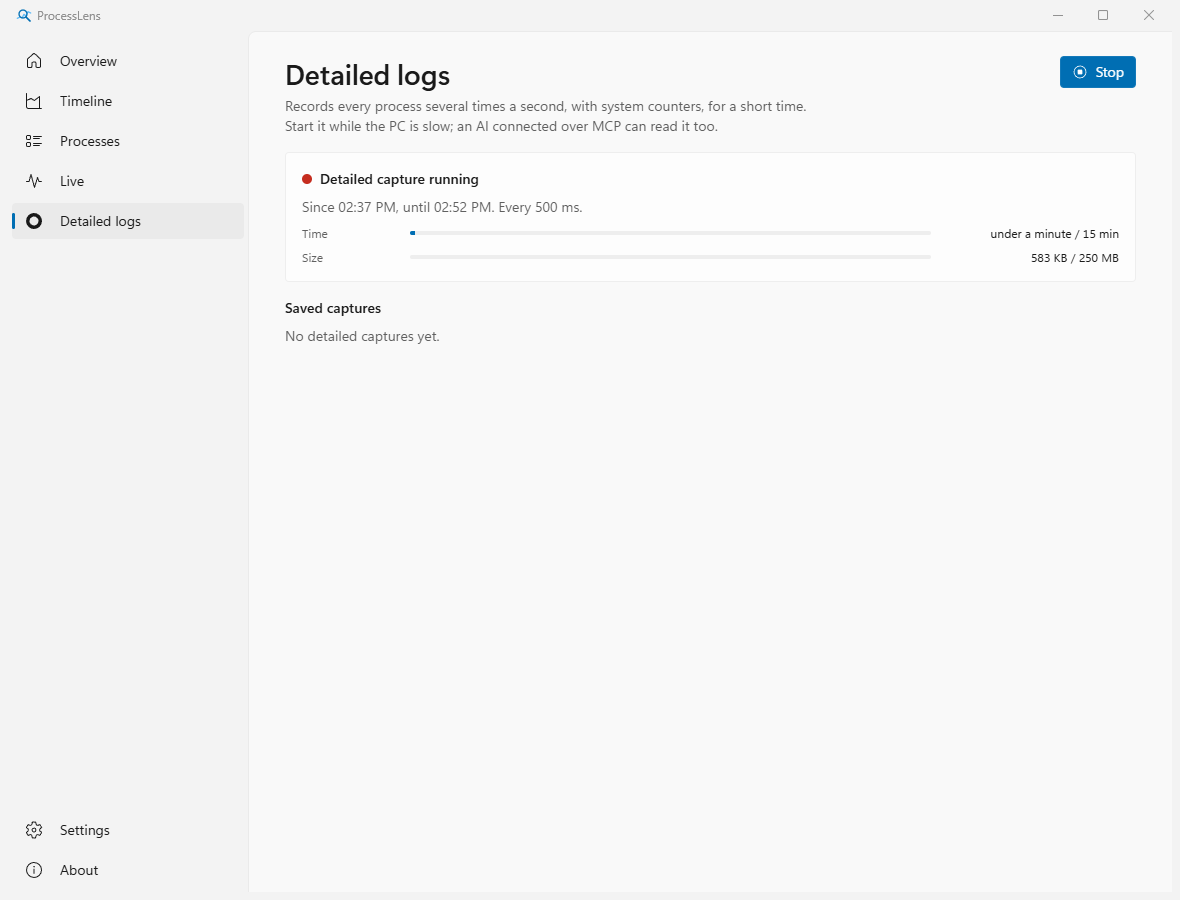
- Each process (idle ones every 10 seconds): CPU as a share of the machine and of its busiest thread, threads, handles, memory (working set, private, commit), page faults and hard faults per second, disk read, write and other bytes and operations per second, and context switches. Plus process starts and exits with the parent, the services inside each svchost.exe, and the path.
- The system: CPU per core, DPC and interrupt time, processor queue, available, standby, modified and free memory, the page file, and per disk active time, queue, throughput and read/write latency.
- Markers: slowdowns and unusual activity from the normal history that overlap the log.
- Export as one zip:
capture.jsonwith everything and a CSV per table, with units in the column names. Logs are deleted after 30 days or when together they pass 2 GB.
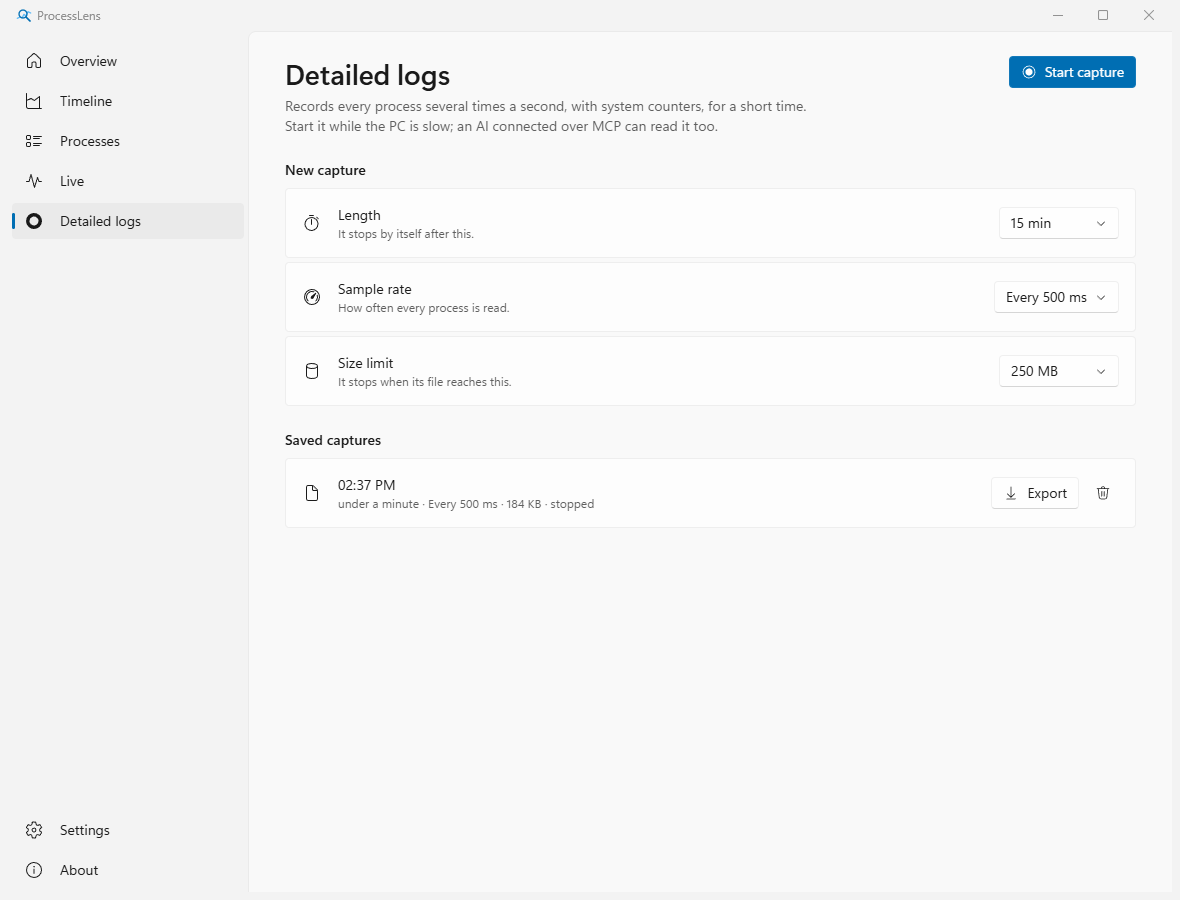
The cost is small and measured: a log at 500 ms uses 1.6 % of one core (0.10 % of a 16-thread CPU) and writes about 2 MB a minute, about 30 MB for 15 minutes.
AI connection over MCP (optional)
ProcessLens can act as an MCP server, so Claude Code, Claude Desktop or another MCP client can look through your history itself and answer questions like "what slowed my PC down yesterday afternoon?". It's off by default and strictly local, over standard input/output: processlens.exe --mcp opens no port.
- Turn on Settings › AI connection (MCP) › Allow AI access. While it's off, every request is refused.
- Copy the ready line for your client from the same page. For Claude Code it looks like this, with your install path:
claude mcp add --scope user processlens -- "<path>\processlens.exe" --mcpFor Claude Desktop, the page shows the mcpServers entry for claude_desktop_config.json.
The AI gets ten read-only tools: system_summary, list_episodes, get_episode, top_processes, process_history, list_anomalies, kb_lookup, compare_ranges, list_captures, get_capture. The only two that change anything are start_capture and stop_capture, which start and stop a detailed log. The AI can't end processes or change settings. Answers are paged and kept under 40,000 characters, with units in the field names and local times with their offset. Turn access off and requests are refused again.
Settings
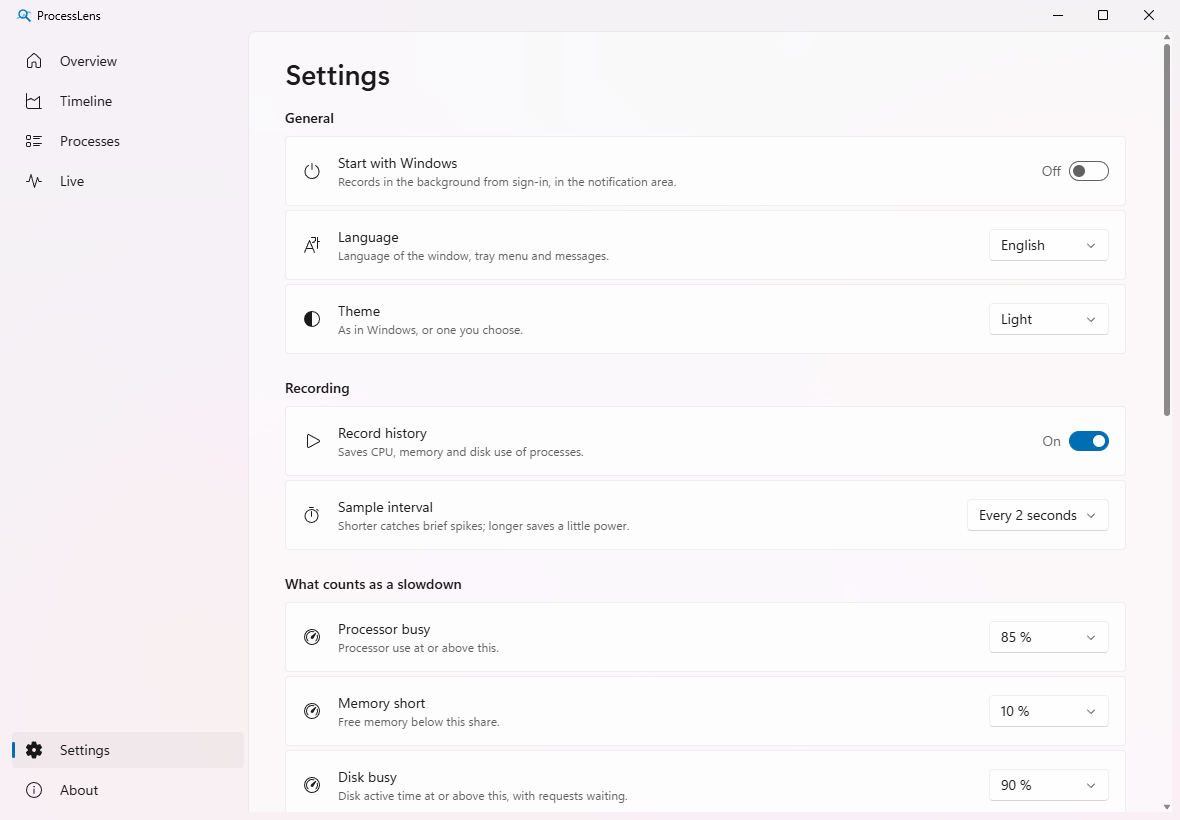
Everything that matters is adjustable: start with Windows (off by default), language, theme, the sample interval from 1 to 60 seconds, the slowdown thresholds, how long history is kept and its size limit. Export history as CSV or JSON, clear it, or open the data folder from there too. Recording can be paused from the window or the tray.
How it records
- Every 2 seconds, in one call and in user mode, it reads the whole PC (CPU per core, memory, commit, page file, hard faults, each physical disk's active time, queue and throughput) and every process.
- It keeps the processes that matter: the top 10 by CPU, working set, private memory and disk I/O, plus any above a threshold (2 % CPU, 1 MB/s I/O, 1 GB private). Paths and publishers are read once per program.
- History is a SQLite file: every sample for a day, then 1-minute summaries for 14 days and 15-minute summaries for 90 days (averages and peaks). With the defaults that's about 150 MB, never above the size limit (500 MB by default).
Numbers
A tool for finding what loads your PC can't load it itself. Measured over 30 minutes in the tray, recording every 2 seconds (AMD Ryzen 7 7800X3D, 16 threads, Windows 11):
- CPU: 0.01 % of the machine (0.2 % of one core).
- Memory: 45 MB working set (20 MB private); 24 MB when started with Windows and never opened.
- Window: close it and ProcessLens keeps recording in the tray but frees the window's memory (WebView2 takes about 350 MB while it's open). Clicking the tray icon brings it back in under half a second, in the same place, theme and language.
- Disk: about 2.3 MB of history per half hour, about 110 MB for a full day of 2-second samples.
- Tested on real load: an automatic test keeps the processor, memory and disk busy and checks that each slowdown is detected, pinned on the right program and explained; 21 of 21 checks pass.
- 94 causes in the knowledge base, 12 MCP tools, a 3.2 MB installer.
Privacy: everything stays on your PC
- History lives in
%LOCALAPPDATA%\ProcessLens. ProcessLens makes no network connections and sends no telemetry; links in the app open in your browser only when you click them. - It records program names, paths, publishers and resource use. Not window titles, file names you open, or keystrokes.
- Command lines are never recorded unless you turn them on, and then only in detailed logs, with passwords, tokens and keys masked.
- The AI connection is off until you turn it on, and it's local only.
- Export and clear are in Settings; uninstalling with "Delete the application data" removes everything.
Install
The ProcessLens_0.1.0_x64-setup.exe installer sets it up for your user only, with no administrator rights, with a Start menu entry. Tested on Windows 11 x64; Windows 10 x64 should work. WebView2 (part of Windows 11) is installed from Microsoft if it's missing. The app is written in Rust and Tauri 2, with tests for the collector, analysis, knowledge base, logs and MCP, plus an end-to-end test on the real app that puts load on the PC and checks the slowdown is detected and explained.
Tell me what breaks
Bug reports, ideas for new causes in the knowledge base and pull requests are all welcome: issues on GitHub.
how it is built
- "What was that?" the slowdown was over before Task Manager opened
- A sample every 2 s Rust, one call, user mode
- History in SQLite a day of samples, 14 and 90 days of summaries
- Analysis + 94 known causes compared with usual use, offline
- The culprit and what to do local, open source (MIT)
release register
-
0.1.0
First release
CPU, memory and disk history per process, explained slowdowns with a base of 94 causes, detailed logs and an optional AI connection over MCP.